Quality Assurance
Cloud
Core Services
Software Development
Business Transformation
AI-First Approach
On-Demand Talent
Advisory Search
Assessment & Benchmarking
Succession Plan
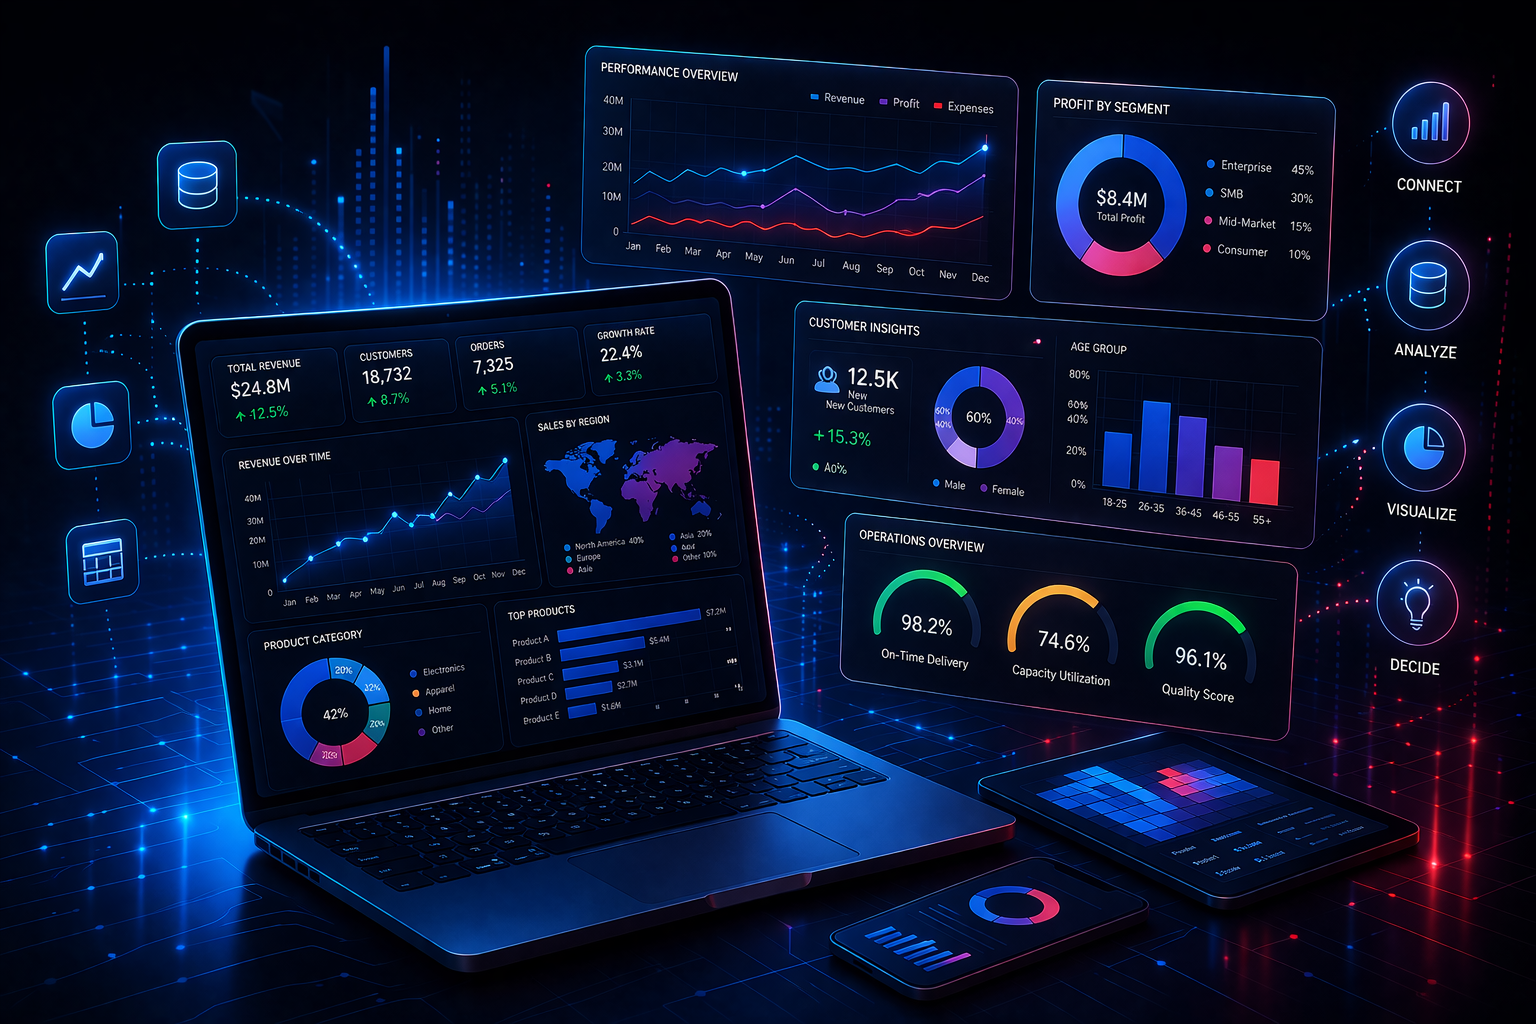
Transform complex data into clear, actionable intelligence. We deliver custom dashboards, real-time reporting, and self-service analytics using Power BI, Tableau, and Looker — aligning teams around a single source of truth.
From custom KPI dashboards to embedded analytics — turning data into decisions.
Role-based dashboards with tailored KPIs, threshold alerting, and drill-down navigation aligned to business outcomes.
Live dashboards with sub-second refresh from operational systems, IoT, and event streams — instant visibility with automated alerts.
Unified semantic models connecting ERP, CRM, SAP, APIs, and cloud services — cross-source analysis without manual reconciliation.
Board-ready scorecards with strategic KPI tracking, variance analysis, and export-ready formatted reports for leadership.
Empower business users with drag-and-drop exploration, natural language query, and row-level security for governed flexibility.
White-labeled dashboards in SaaS apps and portals — SSO, multi-tenant isolation, and responsive embedded experiences.
Industry-leading BI platforms, data modeling engines, and embedded analytics frameworks.
A proven framework — from requirements and data modeling through visual design, development, and deployment — ensuring accurate, performant, and adopted dashboards.
Define business objectives, KPIs, target audiences, and success criteria — mapping data needs to a dashboard blueprint.
Connect sources, build unified semantic models with optimized relationships, DAX logic, and quality validation.
Design intuitive layouts — chart selection, color palettes, navigation flows, and mobile-responsive prototypes.
Build with optimized DAX, incremental refresh, custom visuals, and drill-through — targeting sub-3-second loads.
Deploy to workspaces or embedded environments — configure RLS, scheduled refresh, training, and usage tracking.
Live dashboards with instant KPI visibility and automated threshold alerting for proactive decisions.
Consolidate ERP, CRM, SAP, and APIs into one model — no more manual reconciliation or spreadsheet wrangling.
Dashboards built around your objectives — cascading metrics from corporate to individual level.
Reduce IT report backlog by 70% — business users explore data independently with governed flexibility.
Microsoft, Tableau, and Looker certified professionals with deep product knowledge and best practices.
Proven delivery across finance, healthcare, retail, and logistics — domain-specific KPI frameworks included.
Beyond building — user training, feedback loops, and usage analytics to ensure dashboards drive real value.
Unbiased recommendations across Power BI, Tableau, Looker, and Qlik — tailored to your stack and users.
Complex DAX optimization, calculation groups, dynamic RLS, and performance-tuned semantic models.
Information architecture, chart science, WCAG accessibility, and mobile-first responsive design.
Connect 50+ source types, build unified semantic layers, and implement incremental refresh at scale.
End-to-end embedding with multi-tenant isolation, SSO, and branded experiences via Power BI, Tableau, or Looker SDKs.
Content lifecycle management, certification workflows, usage monitoring, and Center of Excellence setup.
From custom KPI dashboards and real-time reporting to embedded analytics — build the visualization platform your organization demands.